“Unleashing the weird world of BETA-I”

Hope you like my last article on risk premium. The last things that is required to calculate cost of equity is Beta. It basically measures the extent to which stocks move with respect to the market portfolio. For example: – Beta value of 1 for a particular stock shows that it behaves in the same way as the market portfolio.

Generally Beta can be calculated by using three methods. Firstly by using historical data, secondly through fundamentals and thirdly by using accounting methods. All methods have their own advantages as well as disadvantages. I will discuss all the three methods one by one in my blogs. Let’s start up with the calculation of Beta with the help of Historical return.

This is the conventional approach for estimating betas used by most services and analysts. For firms that have been publicly traded for a length of time, it is relatively straightforward to estimate returns that an investor would have made on its equity in intervals (such as a week or a month) over that period. The standard procedure for estimating the CAPM beta is to regress stock returns (Rj) against market returns (Rm) .It is given by

Rj = a + b Rm

where

a = Intercept from the regression

b = Slope of the regression = Covariance (Rj, Rm) / σ2

The slope of the regression corresponds to the beta of the stock and measures the riskiness of the stock.  This slope, like any statistical estimate, comes with a standard error, which reveals just how noisy the estimate is, and can be used to arrive at confidence intervals for the “true” beta value from the slope estimate.

There are three decisions the analyst must make in setting up the regression described above. The first concerns the length of the estimation period. The trade-off is simple: A longer estimation period provides more data, but the firm itself might have changed in its risk characteristics over the time period. The second estimation issue relates to the return interval. Returns on stocks are available on an annual, monthly, weekly, daily and even on an intra-day basis. Using daily or intra-day returns will increase the number of observations in the regression, but it exposes the estimation process to a significant bias in beta estimates related to non-trading. For instance, the betas estimated for small firms, which are more likely to suffer from non-trading, are biased downwards when daily returns are used. Using weekly or monthly returns can reduce the non-trading bias significantly.

The third estimation issue relates to the choice of a market index to be used in the regression.  In most cases, analysts are faced with a mind-boggling array of choices among indices when it comes to estimating betas such as BSE 200, Sensex, Nifty etc. One common practice is to use the index that is most appropriate for the investor who is looking at the stock.

Month L&T Sensex
Jan-10 -0.160747939 -0.063839139
Feb-10 0.09954386 0.005522262
Mar-10 0.026088328 0.066266588
Apr-10 -0.016450084 0.000209057
May-10 0.017875 -0.033770584
Jun-10 0.107289685 0.044743437
Jul-10 0.001169916 0.010687616
Aug-10 0.003571429 0.003339231
Sep-10 0.123461538 0.113273779
Oct-10 -0.011175234 -0.003073539
Nov-10 -0.038535503 -0.037057115
Dec-10 0.014871414 0.050133154
Jan-11 -0.175301508 -0.111235253
Feb-11 -0.073909091 -0.032660739
Mar-11 0.070064725 0.081354533
Apr-11 0.024182418 -0.017534711

Source: BSE India


Estimation of Beta with the help of an Example

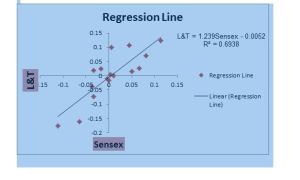
From the table we will do the regression analysis by using scatter plot as shown in the figure. The slope of the regression line will give the value of Beta which is equal to 1.239. But this beta is not free from error. Suppose the standard error is .20. Hence the value of beta lies in between 1.039 to 1.439 for 67 % confidence interval and .839 to 1.639 for 95 % confidence interval.

Generally most of the Analysts use the value of beta find out by agencies such as Bloomberg, Wall Street, S&P etc. But again their value varies according to time frame, index selection and interval to calculate the value of beta as explained above.

Hope this article to calculate the value of beta by using historical data helps you. Be ready to learn two different ways to calculate beta in my next blog.

1 Comment

Filed under Uncategorized

Get Started with DCF!!!


Dear Friends, Hope the last post helps you in understanding the basic fundamentals and assumptions that we take while doing valuations. But now the question is how should one approach while using DCF to do valuation. What should he look upon before doing valuation? What should be his assumptions? And many more such intriguing questions.

But before getting into the complex but simple (Complex for those who mug up valuations and simple for those who understand valuations) world of DCF, Let’s first understand one important property of DCF that greater the value of the cash flow that a firm will generate in the beginning greater will be the value of the firm, than the firm whose cash flow in the beginning is smaller compare to later years. The concept is simple because with increase in time the present value of the cash flow decreases, which means that getting Rs. 100 one year from now will have more value than getting Rs. 100 two year from now. Second important thing that we must put into mind while doing valuation is that it not only considers the present cash generation capacity of the firm but future cash generation also. Hence, one must have thorough knowledge about the company and the industry to which it belongs while doing the valuations so that he can take right assumptions about the company.

There are two types of methods that come under DCF; those are FCFF and FCFE, where FCFF stands for Free Cash Flow for the Total Firm whereas FCFE stands for Free Cash Flow to Equity. If your assumptions and calculations about the company are right then you can easily get the value of one from the other though there are separate formulas available for calculating the value of each method, which I will explain in later post.

FCFF= FCFE + Total Debt

Now, while using the above formula you must be cautious that what should be the value of total debt. Should it include both long term and short term or just the long term debt? For this one will have to keep certain things in mind. Firstly, it is on you that what debt amount  you are going  to use for calculating one value from the other ( FCFF from FCFE or vice versa), but whatever value of the debt you are going to use you must use the same thing while calculating the cost of capital(WACC- will explain its concept in later post) also.

Now, the question is when to use FCFF and when to use FCFE? In order to answer this question you must keep in mind that for which purpose you are going to do the valuations. If you are doing it to find the value of the total firm then goes for FCFF or if you want to do the valuation for equity goes for FCFE. Secondly, you can use FCFF to find the value of FCFE for the firm which is having stable leverage ratio (Debt/Equity ratio) over a period of time. It means that the firm which is having stable leverage ratio over a period of time, you can first calculate FCFF and then subtract the value of Debt to get the value of FCFE rather than calculating FCFE directly from its formulae.

Hope this post helps you in understanding the fundamentals about various methods of DCF. Keep ready to fly with me to experience the adventurous path of FCFF in my next post.

Leave a comment

Filed under Uncategorized

Fundamentals of Valuations!

Hi Friends! Hope you like my last post. I am sure that those who read my last post got slightest of idea about valuations. Now, my question is why we do the valuations? Because in my last post I did the valuations for a shop to make you people understand its concepts, but in reality Investors do it to find the true or intrinsic value of a firm. This help them in deciding to go for buying or selling decision of the firm’s stock based on its current market price.

One thing that puzzled me was that if there was something like true or intrinsic value of a firm, then why don’t investors simply do the valuations before investing in a firm’s stock and earn lot of money because true value always give the right value .And if they are doing so then why people are losing money in the stock market. So, is there something like true or intrinsic value for a company or it is just a myth? Now, my answer to this question is that valuation is based on future earnings, discount rate etc. and all these things depend on lot of assumptions and historical data. So, the value that comes out from the valuation is not actually the true value but a biased value based on many assumptions. That’s why if one read the equity resarch report from different agencies; one can find different value for the stock of the same company because every agency takes assumptions as per their own understanding about the company and its fundamentals. Hence, there is nothing like true or intrinsic value, but a biased value which gives us a rough idea about the company true value.

Now, one might ask that when the market price is available why should we do the valuation? Why don’t we directly refer the market price and make our decisions of buying and selling? There is no clear cut answer to these questions and therefore we make the most important assumptions of Valuations i.e. the markets are inefficient and make mistakes in accessing value because in an efficient market, the market price is the best estimate of value. That’s why we do the valuations to find out the rough estimates about the true value of the company stocks and then on the basis of our assumption of inefficient market, we make the decision of buying or selling.

There are many methods available for doing valuations but the most famous and commonly used method is discounted cash flow models (DCF). As the name suggests, this methods discount the future cash flow of a company to find out its present value (As explained by me for Ram’s shop in my last post). The basic of this model is the philosophy that “Every asset has an intrinsic value that can be estimated, based upon its characteristics, fundamentals growth and risks”. Hence, for investors who think to buy businesses rather than stocks while making investment, DCF is the best way to predict its value. Secondly, it is based on company fundamentals and intrinsic characteristics, so it is less exposed to market moods and perceptions.

Hope this post helps you to understand the basis of valuations and DCF.Be ready to explore the mysterious world of assumptions and complex calculation while doing valuations using DCF in my next post.

Leave a comment

Filed under Uncategorized

Master the art of Valuation!

Welcome to the world of Equity research! Every now and then whenever I come across any equity research  or valuation report, I feel puzzled that how on earth a human being did such complex analysis? What are their assumptions? These reports haunted me a lot until I came across the blog of Prof. Damodaran . I followed his lecture slides religiously and tried to explore the world of valuation from Indian perspective. In the beginning I faced lot of difficulties but as I proceeded I saw the things are not as difficult as they seem to be. So, I got an idea to share my experience with you and help you to understand this weird world of analysis and valuations.

Before getting into any technical details, let’s first understand what valuation is and how can we do it from layman’s perspectives? Let’s assume that Ram is a shopkeeper and he wants to sell his business to third party. His shop is having a good reputation in nearby locality and is known for quality products and services. But since his family is planning to move to some other place, so he doesn’t have any other option then to sell his business. Now, the question is how can he value his shop? Should he sell it with the price equivalent to the costt of inventory he is having? (He does all his transactions in cash so no account receivables and payables)

Many of you who are reading this blog simply tell that he should sell his business equivalent to the cost of inventory he is having in his stores. This sounds rational too as there is nothing wrong in selling the business equivalent to the amount of inventory he possesses. But you are wrong and it is here where the role of valuation comes in to the picture. How? Simple, what is the cost of the name and fame that he gains for his shop from his sheer hardworking? What is the cost of the guaranteed income that you will earn by buying his shop? So, he shouldn’t sell his shop in just the amount equivalent to the inventory rather he must calculate the cash flow that he will generate from his shop and then discount it with the return that he is getting from its shop to get the actual value. He can easily get the return percentage from its past profit to calculate the true value of the firm.

Now, replace Ram’s shop with some big firm and repeat the same thing, you will get the valuation of the firm. But here you will have to subtract all the expenses and add depreciation, amortization etc. to get free cash flow which you will discount with the company’s cost of capital to get the actual value of the firm. Kindly remember that there lies lot of difference in the valuation of the firm and the Ram’s shop as the former involves lot of assumption and complex calculation which I will explain in my next post.

Be ready to explore the world of valuations with me from my next post  where I am going to explain the concept of discounted cash flow in Indian context.

Leave a comment

Filed under Uncategorized

“Understanding Risk Premium- An important step to calculate Cost of Equity”

It has been long time since I came out with a blog. Today, I am going to concentrate on Risk premium. The CAPM model which is basically used to quantify the market risk in the form of market return consists of two things which is given by

Ke = Risk free rate + Risk premium

= Rf  + ( Rm – Rf )

The second value basically speaks about the premium that an investor expects from his investment for taking extra risk to invest in the stock of a particular company. The most simple step to calculate risk premium is to subtract ( Rf) from expected market return ( Rm ). But the problem with this approach is that we use historical data to calculate the average value of Rm. Hence, the value changes significantly with change in sample size and the method use to find average. Secondly, the standard error also increases with increase in the standard deviation of the return as standard error is given by

S.D/ Sqrt(n)

Where n= Sample size

For example, If we calculate Rm from past 20 years data of BSE with an assumption that standard deviation is 20 %, then the value of standard error will be around 4.4 %, which is significantly large. Hence we must explore some other methods to calculate Risk premium.

Equity risk premium can also be calculated by using country risk premium. Generally, Country equity risk premium shows the value that an investor expects to get because of the extra risks that he takes compare to stable equity market. For ex, the U.S.A market is considered extremely stable. Hence, CERP for U.S.A is must be kept minimum or zero.

Country risk premium can be calculated in one of the two ways

1)      By treating the value of CERP equal to the value of default spread i.e. the extra return that an investor expects from the risk associated with country bond as compare to stable market bond as per the rating given by rating agencies But the problem with this approach is that the risk taken by equity’s investors is more than bond’s investors. Hence, CERP should be more than default spread.

2)      In order to overcome above problem we can adjust the above calculated CERP by multiplying it with ratio of standard deviation of country’s equity market and the country’s bond market.

Adjusted CERP = Default spread * ( S.D of equity market/ S.D of Bond market)

We generally use second method to calculate CERP. Hence, here onwards we use CERP in place of adjusted CERP in all the discussions. Once we calculated the CERP,  the  risk premium associated with one’s equity can be calculated in one of the following two ways:-

1)      If we assume that the risk taken by company in other country is similar to home’s country, then  Risk premium is given by

Risk premium = Beta*(CERP+ US premium)

2)      If we assume that the risk is different in different countries then,

Risk premium = Beta*(US premium) + lambda *(CERP)

Here, lambda shows the ratio of revenue earned by company in domestic market to the average revenue earned by similar’s business firm in the same market. In the above example we used US premium while calculating risk premium because we assume that the US is the most stable country and there is negligible or no risk associated with US market.

Hence, once the risk premium is calculated, add it to risk free rates to get cost of equity (Ke). Hoping, this article will help you in understanding the concept behind calculation of (Ke) by using different approaches. Kindly follow my blogs to explore the world of financial modeling and valuations.

Leave a comment

Filed under Uncategorized

“Risk Free Rate – Logic Behind Basic Assumptions”

Hi friends! Hope my last post on cost of capital helps you in understanding its fundamentals and various factors affecting it. As discussed in the last post, the cost of Equity is given as

Ke = Rf + Beta* ( Rm-Rf)

Where

Rf = Risk free rate

Rm= Expected return from the market

Here, Risk Free rate is rate at which there lies no variance around the expected return rate. It means that on a risk free asset, the actual return is equal to the expected return. For any investment to become risk free it must satisfy two conditions which are as follows:-

1)      No Default risks

2)      No Reinvestment risks

The first condition states that it shouldn’t carry unwanted risks i.e. Business risks, financial risks or any other risks whereas second one states that there should not be any risk associated with the reinvestment of the money in the same assets.

Besides these the other two things that one must keep in his mind while taking assumptions for risk free rate is that time horizon matters , which means it is always better to take risk free rate of that assets for the current period rather than from any historical data. It also states that it is always better to take risk free rate for that asset whose time period of maturity matches with the time period of your valuation. Suppose you want to do valuation for a company by taking cash flow for 10 periods, then it is better to take 10 years Treasury bond rate as Rf rather than 6 months treasury bill rate because reinvestment risk is attached with 6 months treasury bill. Secondly, not all government securities are risk free.so, before using any Government securities rate as risk free rate kindly check the risk associated with it. For example, most of the analysts in the world uses U.S. Treasury bond as risk free rate but after 2008 crisis Moody has downgraded U.S. bond ratings from Aaa grade. So, we can’t take it as risk free rate rather we must subtract its credit spread associated with its bond ratings to get Rf.

One can calculate risk free rates in three ways

Ø  Risk free rates when valuation is done in local currency:-When we want to do valuation for a company in local currency then the best way to calculate the risk free rate is to subtract the Credit spread from the local government bond rate. Now, the question arises, why we subtract the credit spread? And the answer to this question is that as discussed above not all Government securities are risk free rather they have some inherent risks which is calculated by Credit Rating agencies and is given in the form of Credit spread. Hence, once we subtract that credit spread we will get the Rf. The credit spread arises because of various economic, social, political, legal etc. risks associated with a country. Hence, as an investor I will invest in those bonds when I will be getting the premium and that premium is calculated in the form of credit spread by the rating agencies.

Ø  Risk Free rate in Real term:-When you are doing valuation in real term then take the government inflation indexed bond as risk free rate or if such rate is not available then take the normalized value of the growth rate of country as risk-free rate.

Ø  Stable currency denominated bond can be used as risk free rate but it must be issued by the country whose currency you think is stable. For ex- Dollar ( Though Moody has downgraded the rating of U.S. bond but still people all over the world uses it), Euros.

One thing that we must keep in mind that the risk free rate varies across currencies, therefore we use stable currency denominated bond as risk free rate. The reason behind difference in the risk free rate for different currencies is that every currency is associated with the economy of its host country and hence any downslides in the economy affect its stability. Hence, risk free rate varies across the currency depending upon the stability of its host country. (Please note that there are many other issues attached with the stability of the currency)

Hope this blog helps you in understanding the way one will take risk free rate. Be ready to explore the world of Risk premium in my next post.

Leave a comment

Filed under Uncategorized

“Cost Of Capital- Clarify your Basics”

Hi Friends! Hope my last post on myth behind numbers helps you in developing insight to look beyond numbers while making a decision about company or projects because numbers are often illusory in nature, one can easily twist and manipulate it as per one’s advantage. Hence, be careful while taking decision just on the basis of numbers.

Let’s start today’s post from the point where I left my fourth post. I think after getting through my previous posts you can easily calculate the FCFF or FCFE, if the balance sheet of the company is given. But the real problems lie in calculating or making assumptions about the factors that I had mentioned in my fourth post. These factors are quite important for calculating the enterprise value. Today, I am going to explain to calculate one’s such factor that is how to calculate Cost of Capital. Please keep in mind that it is the same cost of capital/WACC that is used to discount all the future cash flows to find enterprise values. Since, it involves many sub factors; it will take minimum 5 to 6 post to cover the whole concepts. Now, before getting into the details please look at the factors essentials to consider before calculating Cost of capital or WACC. These factors are as follows:

Factors Consideration
Models used If you are using FCFF for your calculation then use cost of capital for discounting else use cost of equity for FCFE. Any mismatching will lead to erroneous results
Currency used The currency used for estimating cash flows and discount rate should be same.
Inflation If you consider inflation in your cash flow i.e. calculating Nominal cash flow then discount rate should be nominal and vice versa.


. The formula to calculate WACC is given by

WACC = (E/V) * Ke + D/V * ( Kd) * (1-Tc)

Where:
Ke = cost of equity
Kd = cost of debt
E = market value of the firm’s equity
D = market value of the firm’s debt
V = E + D
E/V = percentage of financing that is equity
D/V = percentage of financing that is debt
Tc = corporate tax rate

From, the formula it is clear that while calculating firm’s cost of capital each category of capital is proportionately weighted. Generally, a company’s assets are financed by either debt or equity. WACC is the average of the costs of these sources of financing, each of which is weighted by its respective use in the given situation. By taking a weighted average, we can see how much interest the company has to pay for every dollar it finances.

The first thing that we will have to consider in order to calculate Cost of Capital is Cost of Equity. The most common method used to calculate Ke is CAPM Model. It basically describes the relationship between risk and expected return and that is used in the pricing of risky securities.The formula is given by

Ke = Rf + Beta* ( Rm-Rf)

The general idea behind CAPM is that investors need to be compensated in two ways: time value of money and risk. The time value of money is represented by the risk-free (Rf) rate in the formula and compensates the investors for placing money in any investment over a period of time. The other half of the formula represents risk and calculates the amount of compensation the investor needs for taking on additional risk. This is calculated by taking a risk measure (beta) that compares the returns of the asset to the market over a period of time and to the market premium (Rm-Rf). Please remember that there are many complexities while calculating Ke, which I will discuss in my next post.

Hope this post helps you in understanding the basics of Cost of capital. Be ready to enter the world of risk free rate in my next post.


2 Comments

Filed under Uncategorized

“Delusory Numbers- Sharpen Your Analytical Skills”

Hi Friends! Hope you like your journey with me to understand the world of valuations. Today, I want to digress a bit from my actual topic of Valuations and will tell something about qualitative aspects that help u greatly in evaluating a company prospects. In valuations, what we do is that  most of the time we put  efforts in collecting historical data, assumptions and other details to carry out our analysis, but we forget the underlying risks that the company might face because of those assumptions. These risks greatly affect the company’s decisions about the selection of a particular project.

Suppose there is a company which wants to decide whether to go for a project or not that gives very good return but carry a great risk. What will be your answer? Confuse. The answer to this question is actually subjective because the fate of this project lies on the designation of the person who will take that decision. Suppose the decision making lies in the hand of an investor, the best decision for him will be to go with the project as his association with the company is very limited i.e. equal to the amount of money that he invests in that company .So, he wants to maximize his return. Now, think from an CEO/CFO perspectives, he may not want to go with this project as it carries huge risks and might put his careers in trouble. What’s if the decision to select the project lies in the hand of the Board of directors, they will definitely select the projects which will not affect the health of the company in the long run. So, they will analyze its effect from all angles and will take the decision accordingly.

Do you have any idea why I gave the above example? Because I want to show that the risk taking capabilities varies from person to person.in the above situations one can easily see that for investors it is highest whereas for CEO/CFO it is lowest. Now, let’s understand the above concept with different angle. Suppose a company want to invest in a project costing Rs 10 million and will increase the value of the company by Rs 50 million in one year, but its chance of success is 60 %. Now, as a decision maker how can you evaluate the above scenario? The given table shows the different scenarios.

Factors Success Failure Expected (60%)
Cost -10 -10 -10
Return 50 0 30
Net return 40 -10 20

Now, the answer to this question is simple since the expected return is 20 million and the rate of return on project is very high i.e. 200 %, it would be better that we will go with the projects. But in real world, the scenario is totally different because there is nothing like by chance, expected or probability because there lies only two scenarios i.e. upside or downside. If it will be upside it is ok but what will happen if it is downside? Again, it depends on many factors. Suppose the total value of the firm is 8 million before the project and you used debt to finance this project. Now, what will be your answer?

No, because if it fails, your company will be in red. What if the size of your company is 1000 million, have cash reserves of 100 million and yearly cash flow of 50 million. Simply, yes. But in reality it is not like that because many companies give importance to current income or quarterly income than any future gain. So, in case of loss it will affect their income. Similarly some CEO /CFO do not go with such projects because it might affect their reputation in case of failure as risk is high. Hence, in real world decisions depend on many factors apart from delusory numbers.

Hope you like the analysis given by me. Be ready to explore the world FCFF i.e. the world of assumptions and complex calculations in my next post.

Leave a comment

Filed under Uncategorized

“Understand the Difference- FCFF and FCFE”

Hi Friends! Hope my last post might help you in gaining some insights about FCFF and FCFE.  Let’s begin today’s journey with a basic question i.e. what is difference between FCFF and FCFE in terms of cash flow?  FCFF is actually the cash available to bond holders and stock holders after all expense and investments have taken place whereas FCFE is the cash available to stock holders after all expense, investments and interest payments to debt-holders on an after tax basis.

Hence the basic difference lies because of consideration of interest payment in FCFE i.e. in FCFE you subtract the interest expense from the cash flow to do valuations. Hence, FCFF shows the obligations for both stockholders as well as bondholders whereas FCFE consider only the obligations for stockholders. Apart from the difference mentioned above and in my last post about FCFF and FCFE, there lies some more difference which is basically related to approach that we will use while doing valuation.( Will discuss in details in my later post)

Now, the question is how do we calculate the FCFF and FCFE? FCFF can be calculated by using the formulae as mentioned below:-

FCFF = EBIT (1- t) + Depreciation + Amortization – Change in Non- Cash Working Capital

– Capital Expenditure

Where,

EBIT = Earnings before income tax

t      = Corporate tax rates

Whereas FCFE can be calculated by using formula mentioned below,

FCFE = Net Income + Depreciation + Amortization – Change in Non- Cash Working Capital

*(1-D) – Capital Expenditure*(1-D)

Where,

D     = Debt ratio

Now, there lies two important points about these formulas, those are as follows:-

1)      In FCFF, we use EBIT (1-t) whereas in FCFE, we use Net Income; this is because while using EBIT (1-t) in FCFF we do not consider the effect of interest payment as mentioned above.

2)      IN FCFE, we use Change in Non- Cash Working Capital*(1-D) – Capital expenditure*(1-D) whereas in FCFF we use  Change in Non-Cash Working Capital – Capital Expenditure; this is because we just want to concentrate on cash flow due to equity only.

The calculation of FCFF or FCFE is the first step to do valuations. Now, the important question is what are the important factors that we must consider while calculating EV through FCFF and FCFE methods? The different factors that one must consider are as follows:-

Factors FCFF FCFE
Cash Flows Pre Debt Cash Flows (already mentioned above) post Debt Cash Flows (already mentioned above)
Expected Growth Growth in Operating Income = Reinvestment rate * ROC Growth in Net Income 

= Retention ratio * ROE

Discount Rate WACC Cost of Equity
Beta Bottom- up Bottom-up

These factors are of no use until you know about the assumptions you must take while calculating EV through FCFF and FCFE methods. Hence, the art of valuations lie in your understanding about these factors and its uses which I will explain later.

Hope this post helps you in understanding the difference between FCFF and FCFE from cash flows perspectives. Be ready to explore the world of assumptions in valuations in my next post.

2 Comments

Filed under Uncategorized

Hello world!

Welcome to WordPress.com. This is your first post. Edit or delete it and start blogging!

1 Comment

Filed under Uncategorized